Upcoming Mentoring Sessions
RMS - Indian Physiography - Archipelagos of India
RMS - Indian Physiography - Coastal Plains of India
RMS - Art & Culture - Bhakti Movement
RMS - Polity - Elections & Political Parties
RMS - Indian Physiography - The Great Indian Desert
Step-Up RMS - Economic Survey and Budget : Part - 2
Step-Up RMS - Resources - Forests, Soils, Minerals etc : Part - 2
Step-Up RMS - Environment and Biodiversity Current Affairs : Part - 2
Step-Up RMS - History : 1935 - Independence
Step-Up RMS - Science and Technology Current affairs - Part - 2
Step-Up RMS - History : 1921 - 1935
RMS - A&C - Current Affairs
RMS - Indian Physiography - Peninsular Plateau
RMS - Polity - Services under the Union and the States & Pressure Groups
RMS - Economy - Balance of Payments
RMS - Economy - Trade & Important Government Schemes
RMS - Modern History - 1830 AD to 1857 AD
RMS - Economy - Fiscal Policy & Budgeting
RMS - Economy - Inflation
RMS - Polity - Local-Self Government & Co-Operative Societies
Step-Up RMS - Environment and Biodiversity Current Affairs : Part - 1
Step-Up RMS - Science and Technology Current affairs - Part - 1
Step-Up RMS -History : 1906 - 1920
Step-Up RMS - History 1857-1905
Step-Up RMS - Geomorphology - Types and Distribution
Step-Up RMS - Evolution + Interior of earth + oceanography
Step-Up RMS - History - Constitutional reforms
Step-Up RMS - Medieval History - kingdom chronology + terminology (Part - 2)
RMS - Indian Physiography - The Great North Indian Plain
RMS - Indian Physiography - Intro & The Himalayas
Step-Up RMS - Indian geography - location , landforms
Step-Up RMS - Drainage system + Rivers (India and world)
RMS - Art & Culture - South India
RMS - Economy - Taxation
RMS - Economy - Money and Banking - Part II
RMS - Polity - Union Legislature - Part III
Step-Up RMS – Indian Culture: Architecture + Literature (Part-2)
Step-Up RMS - Human geography
Step-Up RMS - Delhi sultanate + mughal administration
Step-Up RMS - Resources - Forests, Soils, Minerals etc
Step-Up RMS - Climatology + Indian monsoon
Step-Up RMS - Medieval History - kingdom chronology + terminology
Step-Up RMS - Indian school of philosophy -Buddhism & Jainism
Step-Up RMS - Indian Culture : Architecture + literature
Step-Up RMS - Ancient history - chronology + terminology
Step-Up RMS - Economic Survey and Budget
Step-Up RMS - Polity - Miscl-Imp Judgements , Amendments, Miscl concepts etc
Step-Up RMS - Agriculture and related concepts
Step-Up RMS - Polity - Constitutional and Non-Constitutional Bodies
Step-Up RMS - Economics - External Sector
Step-Up RMS - Polity - Judiciary- SC/HC/Lower courts
Step-Up RMS - Economics - Fiscal policy and Financial Markets
Step-Up RMS - Polity - Parliament and State Legislature
Step-Up RMS - Economics - Money and Banking
Step-Up RMS - Polity - Union and State Executives
Step-Up RMS - Economics - Basic Economics and Terminology
Step-Up RMS - Polity - State, Citizenship, FR/FD and Emergency Provisions
RMS - Polity - Judiciary - Part II
RMS - Geography - Biomes and Natural Resources
RMS - Economy - Money and Banking - Part I
RMS - Geography - Oceanography
RMS - Medieval History - 646 AD to 1192 AD
RMS - Art & Culture - Post Mauryan Period
RMS - Polity - Union Legislature - Part II
RMS - Economy - Financial Markets
RMS - Polity - Judiciary Part I
RMS - Polity - Separation of Powers & Federal System
RMS - Geography - Atmospheric Circulation
RMS - Polity - Union Legislature - Part I
RMS - Geography - Air Mass, Fronts & Cyclones
RMS - A&C - Pre-Historic to Mauryan Period
RMS - Economy - Fundamentals of Economy & NIA
RMS - Polity - Emergency Provisions
RMS - Geography - Humidity, Clouds & Precipitation
RMS - Economy - Demography, Poverty & Employment
RMS - Modern History - 1813 AD to 1857 AD
RMS - Polity - Union & State Executive
RMS - Modern History - 1932 AD to 1947 AD
RMS - Geography - Basics of Atmosphere
RMS - Polity - Fundamental Rights - Part III
RMS - Economy - Planning and Mobilisation of Resources
RMS - Modern History - 1919 AD to 1932 AD
RMS - Modern History - 1757 AD to 1813 AD
RMS - Economy - Financial Organisations
RMS - Geography - Major Landforms
RMS - Polity - Constitutional and Statutory Bodies
RMS - Geography - EQ, Faulting and Fracture
RMS - Polity - Fundamental Rights - Part II
RMS - Economy - Industry, Infrastructure & Investment Models
RMS - Polity - DPSP & FD
RMS - Economy - Indian Agriculture - Part II
RMS - Geography - Rocks & Volcanoes and its landforms
RMS - Geography - Evolution of Oceans & Continents
RMS - Polity - Fundamental Rights - Part I
RMS - Modern History - 1498 AD to 1757 AD
RMS - Modern History - 1858 AD to 1919 AD
RMS - Geography - Interior of the Earth & Geomorphic Processes
RMS - Geography - Universe and Earth and Basic concepts on Earth
RMS - Economy - Indian Agriculture - Part I
RMS - Economy - Fundamentals of the Indian Economy
RMS - Polity - Union & its territories and Citizenship
RMS - Polity - Constitution & its Salient Features and Preamble
Learning Support Session - ANSWER writing MASTER Session
Learning Support Session - How to Read Newspaper?
Mastering Art of writing Ethics Answers
Mastering Art of Writing Social Issues Answers
Answer Review Session
UPSC CSE 2026 Form Filling Doubt Session
Mentoring Session (2024 - 25) - How to Write an ESSAY?
Social Issues Doubts and Mentoring Session
Ethics & Essay Doubts and Mentoring Session
Geography & Environment Doubts and Mentoring Session
History Doubts and Mentoring Session
Economy & Agriculture Doubts and Mentoring Session
Online Orientation Session
How to Read Newspaper and Make Notes?
Mains Support Programme 2025-(2)
Mains Support Programme 2025- (1)
Polity & International Relations Doubts and Mentoring Session
Mentoring Sessions (2024-25) - How to DO REVISION?
Learning Support Session - How to Start Preparation?
RMS - Geography - World Mapping
Mentoring Session (2024-25) - How to Make Notes?
General Mentoring Session (GMS )
Mentoring Session (2025-26) - How to write an Answer?
Upcoming Live Classes


Current Affairs
May 6, 2026
Dorjilung Hydroelectric Power Project
The Bhutan government and the World Bank recently signed financing agreements worth $515 million for the 1,125 MW Dorjilung Hydroelectric Power Project, with nearly 80% of its 4,500 GWh annual generation set to be supplied to India.
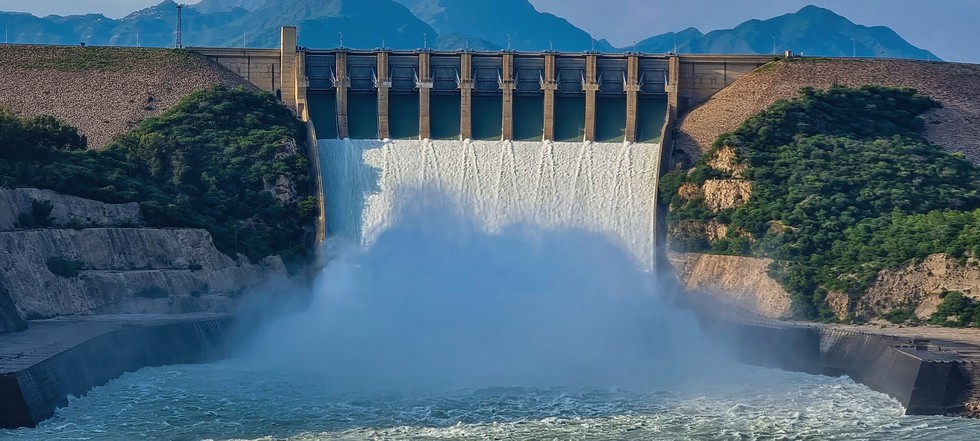
About Dorjilung Hydroelectric Power Project:
- It is a run-of-river project to be built on the Kurichhu River in eastern Bhutan.
- The Kurichhu River is a tributary of the Drangmechhu River that flows into India as Manas River.
- The project involves a concrete-gravity dam and an underground powerhouse housing six Francis turbines.
- The project is financed by the World Bank.
- The project is being developed by Dorjilung Hydro Power Limited, a joint venture between Bhutan’s Druk Green Power Corporation (DGPC) and India’s Tata Power, with DGPC and Tata Power holding equity shares of 60% and 40%, respectively.
- The project is slated for commissioning in 2031, and 80% of its generation will be supplied to India.
Geography

Current Affairs
May 6, 2026
What is UDGAM Portal?
The Reserve Bank of India (RBI) recently told the Supreme Court that 30 banks have been integrated into its centralised web portal, UDGAM, to enable legal heirs to trace funds belonging to deceased account holders.
About UDGAM Portal:
- UDGAM (Unclaimed Deposits-Gateway to Access inforMation) is an online portal developed by the Reserve Bank of India (RBI).
- The RBI collaborated with Reserve Bank Information Technology Pvt Ltd (ReBIT), Indian Financial Technology & Allied Services (IFTAS), and selected banks to develop this platform.
- It facilitates the registered users to search unclaimed deposits/accounts across multiple banks at one place in a centralized manner.
- There are 30 banks, which are part of UDGAM portal, and they cover around 90% of unclaimed deposits (in value terms) in the Depositor Education and Awareness (DEA) Fund of RBI.
- All unclaimed deposits/accounts that are part of the DEA Fund of RBI can be searched in the UDGAM portal.
- It provides information related to both individual and non-individual category of unclaimed deposits.
- Whether a user can settle/claim his/her unclaimed deposits through UDGAM portal?
- No, the UDGAM portal facilitates only
- the search of unclaimed deposits/accounts across multiple banks at one place and
- provides information on the claim/settlement process of each bank (which will be available in the search result).
- The unclaimed deposits can be claimed only from the respective bank.
- No, the UDGAM portal facilitates only
- What is the Unclaimed Deposit Reference Number (UDRN)?
- After registration on the UDGAM portal, a person will get UDRN, which is a unique number generated through Core Banking Solution (CBS) by banks and assigned to each Unclaimed account/ deposit transferred to the DEA Fund of RBI.
- This number is used so that the account holder or the bank branch where the account is maintained cannot be identified by any third party.
- The UDRN enables the bank branches to seamlessly settle claims received from the customers/depositors, who have made successful searches in the UDGAM portal.
What are Unclaimed Deposits?
- According to RBI, “Unclaimed Deposits” refers to funds held in savings or current accounts that have remained inactive for a duration of 10 years, or in the case of fixed deposits (FDs), have not been withdrawn within 10 years from the maturity date.
- Such amounts are transferred by banks to the "Depositor Education and Awareness" (DEA) Fund, which is maintained by the Reserve Bank of India (RBI).
Economy
Current Affairs
May 6, 2026
What is Indopotamon alipurduarense?
Scientists recently discovered a new species of freshwater crab named Indopotamon alipurduarense beneath the agricultural fields of West Bengal
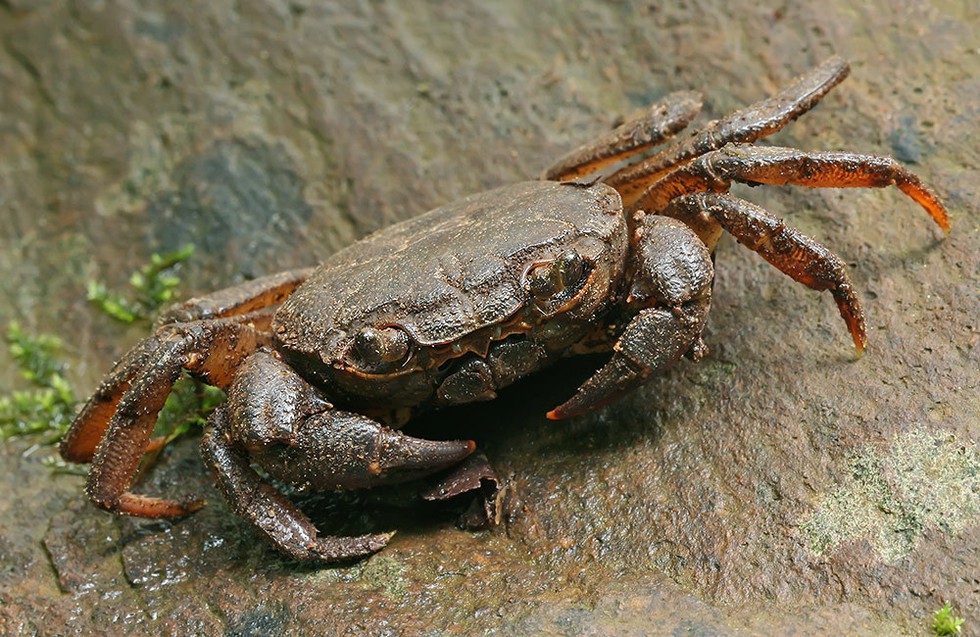
About Indopotamon alipurduarense:
- It is a new species of freshwater crab.
- It was discovered in the sub-Himalayan Dooars region of West Bengal.
- It marks only the second species ever recorded in the Indopotamon genus and pushes the total number of known freshwater crab species in India to 183.
- These highly secretive animals spend the vast majority of the year hidden securely underground.
- They only emerge from their subterranean homes during the region's heavy rainy season, making them visible to researchers and locals only between May and August.
- The crab’s newly assigned scientific name, alipurduarense, is a direct nod to its origins, honouring the Alipurduar district of West Bengal.
Environment
Current Affairs
May 6, 2026
Key Facts about Mahi River
Two persons, including an eight-year-old boy, went missing after a boat capsized in the Mahi River in Rajasthan’s Banswara recently.
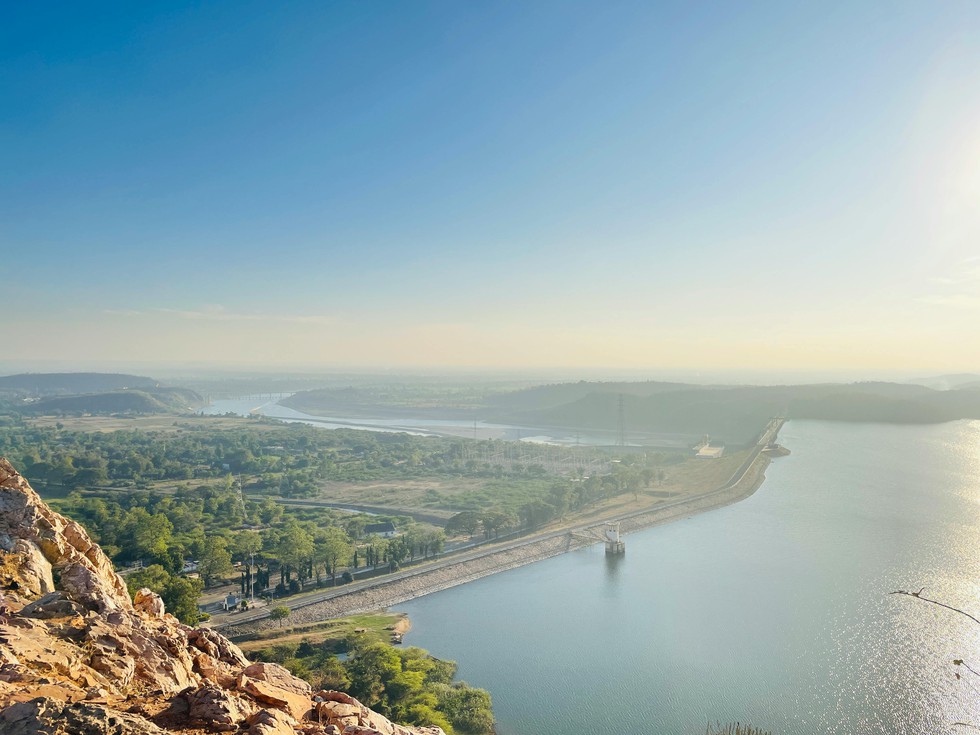
About Mahi River:
- It is one of the major west-flowing interstate rivers of India.
- It flows through the states of Madhya Pradesh, Rajasthan, and Gujarat.
- The river is popularly described as “Mahisagar” due to its vastness.
- Course:
- It originates in the northern slope of the Vindhya Mountain Range in Madhya Pradesh.
- It enters the southeastern portion of Rajasthan, which is the Vagad region.
- Before entering Gujarat, the river makes a `U` shaped loop in Rajasthan.
- Finally, the river surrenders itself to the Arabian Sea by a wide estuary near Khambat.
- Its basin is bounded by the Aravalli Hills on the north and the northwest, by the Malwa Plateau on the east, by the Vindhyas on the south, and by the Gulf of Khambhat on the west.
- The silt brought down by the Mahi River has contributed to the thinning of the Gulf of Khambat and the abandonment of its once-rich ports.
- The riverbed lies considerably lower than the land level and is of little use for irrigation.
- Tributaries: Eru, Nori, Chap, Som, Jakham, Moran, Anas, Panam, and Bhadar.
- Major Dams: Mahi Bajaj Sagar Dam, Kadana Dam, and Panam Dam are crucial for water management.
Geography
Current Affairs
May 6, 2026
Key Facts about Lake Chad
At least 23 Chadian soldiers have been killed and 26 injured in a Boko Haram attack on a military post in Chad’s Lake Chad region recently.
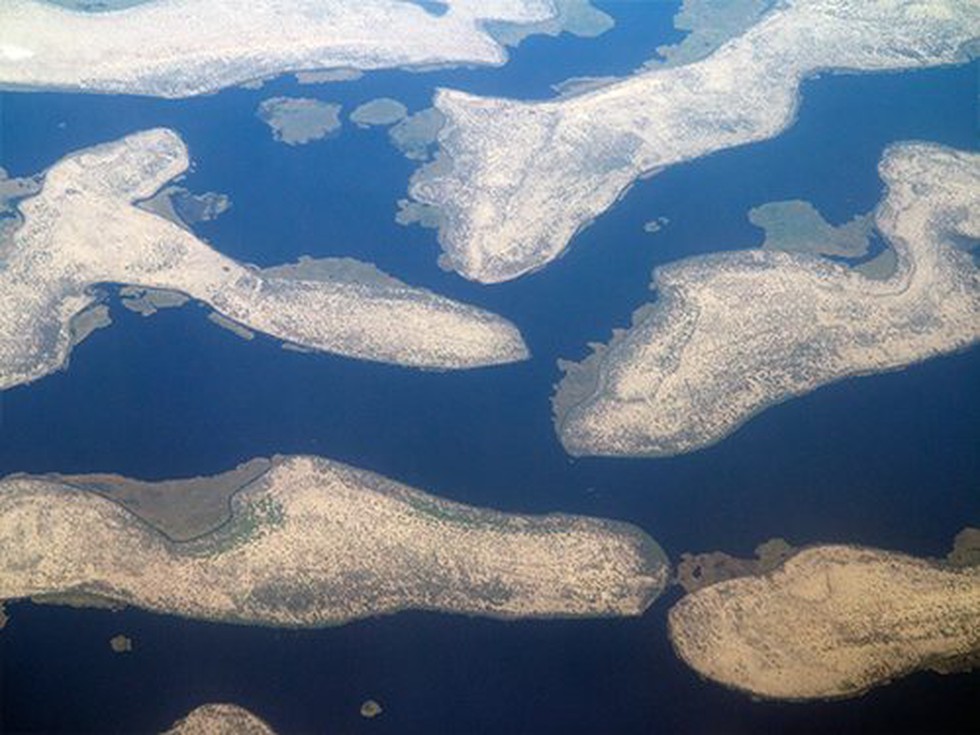
About Lake Chad:
- It is a freshwater lake in the semi-arid Sahel region west-central Africa.
- It is located in western Chad, with some of its parts extending into Cameroon, Nigeria, and Niger.
- Lake Chad was once the sixth largest lake in the world, but prolonged drought and increased water use have shrunk the lake dramatically. It now spans less than a tenth of the area it covered in the 1960s.
- The lake is endorheic (no outlet to the sea).
- The Chari River is the main river feeding into the lake. It accounts for up to 90% of Lake Chad’s water.
- Chad has several small islands, mud banks, and reed beds, which take up half of its area.
- Around the lake, sand deserts and water meet in a complex network of meanders, which are sometimes cultivated.
Geography
Current Affairs
May 6, 2026
New Plant Species
Scientists have identified three new plant species named Euphorbia ananthapuramensis, Euphorbia chalamensis,and Ceropegia andhrica, in the Eastern Ghats of Andhra Pradesh.
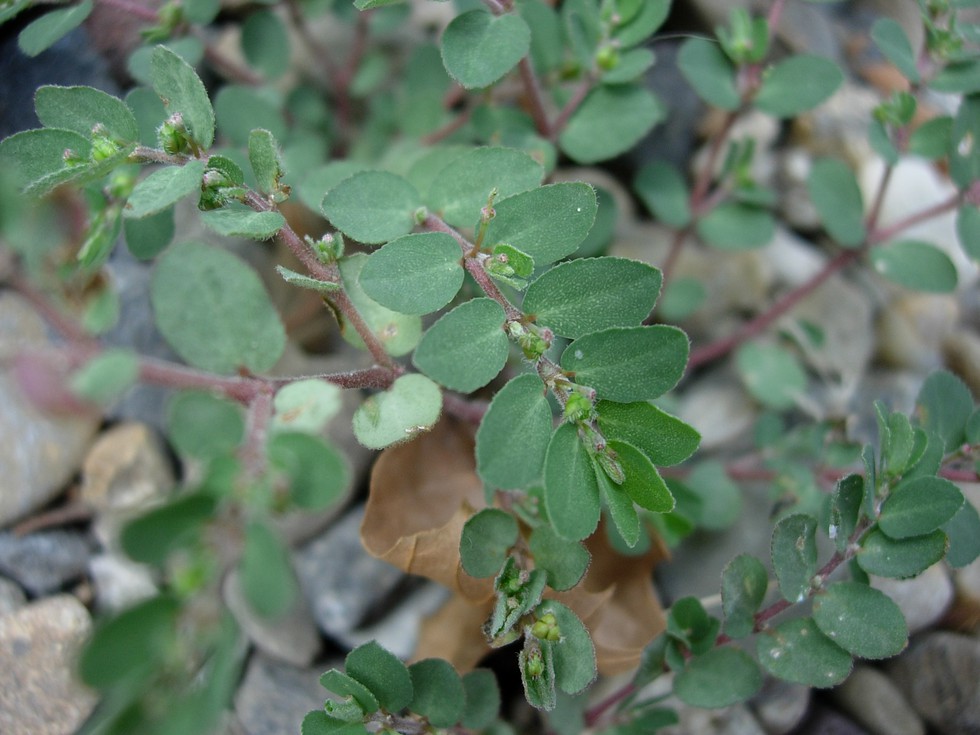
About Euphorbia ananthapuramensis:
- It is a new shrubby plant species.
- It was discovered inNigidi Forest in the Sri Sathya Sai district, Andhra Pradesh.
- It grows among granite rocks in scrub forests.
- It has medicinal properties and is used by local tribal communities to treat wounds, skin diseases, and digestive disorders.
- The species faces threats from granite mining and forest fires.
- IUCN Red List Classification: Critically Endangered
About Euphorbia chalamensis:
- It is a small annual herb.
- It was discovered in Chalama Forest in Gundla Brahmeswaram Wildlife Sanctuary in Nandyal district, Andhra Pradesh.
- It was found in dry deciduous forests.
- It has medicinal properties and is used by local tribal communities to treat wounds, skin diseases, and digestive disorders.
- Forest fires and human activity have been listed among the major threats.
- IUCN Red List Classification: Critically Endangered
About Ceropegia andhrica:
- It is a dwarf tuberous herb.
- It was discovered in Paderu forest division in Alluri Sitharamaraju district, Andhra Pradesh.
- It was found in open forest edges.
- The plant is leafless during flowering, which occurs after the first rains between May and June, and produces leaves later.
- It produces edible tubers roughly the size of small potatoes.
- Grazing, forest fires, and habitat loss threaten the species.
- IUCN Red List Classification:Critically Endangered
Environment
Current Affairs
May 6, 2026
Jim Corbett National Park
Uttarakhand recently witnessed the death of Vikram, a 21-year-old Bengal tiger and one of the most well-known residents of Jim Corbett National Park.
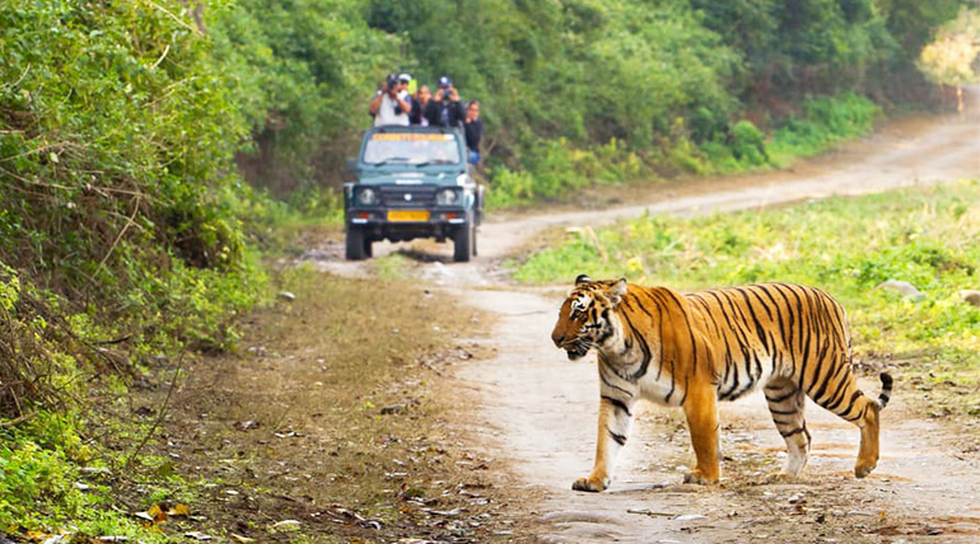
About Jim Corbett National Park:
- It is located in the foothills of the Himalayas in the Nainital district of Uttarakhand.
- It is a part of the Corbett Tiger Reserve.
- It was established in 1936 as Hailey National Park and was later renamed in 1957 in memory of Jim Corbett, a famous hunter turned conservationist, who played a key role in the establishment of the park.
- It is not only the first national park in India but also the first to come under the Project Tiger
- It is spread over the Bhabar and lower Shivalik regions with a deep-water table.
- The tract is porous with boulders and sand deposits.
- Drainage:
- The Ramganga River (West) and its important tributaries - Sonanadi, Palain, and Mandal, constitute the primary water source for the region.
- Additionally, the Kosi River runs adjacent to the national park.
- Vegetation: North Indian tropical moist deciduous forests and tropical dry deciduous forests:
- Flora:
- In general, the park comprises sal and mixed forests, interspersed with grasslands and riparian vegetation.
- The grasslands are locally known as ‘Chaur’, which are an outcome of abandoned settlements or past clearings.
- Evergreen Sal and its combined trees, the Sheesham and the Kanju, are found extensively on the ridges.
- Fauna: Tigers, elephants, leopards, sambar, hog deer, spotted deer, etc.
Environment
Current Affairs
May 6, 2026
Samarth Panchayat Portal
The central government is set to expand the rollout of its Samarth Panchayat portal to states including Assam, Uttar Pradesh and Maharashtra.
About Samarth Panchayat Portal
- It is a unified digital platform designed to empower Panchayati Raj Institutions with efficient governance tools.
- Aim: It aims to digitally empower the panchayats to efficiently collect and monitor revenue under the own source revenue (OSR) Framework.
- It enables seamless access to services, enhances transparency, and simplifies administrative processes for both citizens and officials.
- It shall facilitate in strengthening of the financial capabilities and local governance of panchayats, ensuring improved quality of life for residents at the grassroots level.
- Nodal Ministry: Ministry of Panchayati Raj
Own Source Revenue (OSR) of Panchayats:
- It is the income generated by Gram Panchayats from local sources such as taxes, service charges, rents, leases, and fees.
- Significance: A strong OSR provides financial independence, enabling Panchayats to build better infrastructure, improve water and sanitation, create greener public spaces, and deliver efficient services.
Polity & Governance
Current Affairs
May 6, 2026
Caracal
Recently, officials have confirmed the return of the rare caracal in the Thar Desert near the India-Pakistan border.

About Caracal:
- It is an elusive medium-sized wild cat species.
- It is often referred to as the desert lyn; however, they are more closely related to the African golden cat and the Serval.
- In India, it is called siya gosh, a Persian name that translates as ‘black Ear’.
- Appearance:
- The caracal has a solid build, long legs, a short face, and tufted ears.
- The cat’s fur is generally a red-tan or sand, although some black caracals have also been seen.
- Habitat: It can be found in many environments, such as semi-deserts, savannahs, shrublands, steppes, forests, and woodlands. It prefers dry areas with very little rainfall.
- Distribution: It is native to Africa, Central Asia, the Middle East, northwestern India (primarily in Rajasthan and Gujarat) and arid areas of Pakistan.
- Characteristics:
- Like most species of cat, the caracal is predominantly nocturnal.
- They live in small herds and it is shy and elusive nature makes them difficult to spot in the wild.
- Diet: Caracals are carnivores
- Conservation Status:
- IUCN: Least Concern
- Wildlife Conservation Act 1972: Schedule 1
Environment