Why in News?
Between April-end 2014 and now the rupee has depreciated by 27.6% against the US dollar, from Rs 60.34 to Rs 83.38.
This is marginally higher than the 26.5% from April-end 2004 to April-end 2014, when the rupee fell from 44.37 to 60.34 to the dollar.
What’s in Today’s Article?
- How is the Strength or Weakness of the Rupee Decided?
- What is the EER?
- What are the Two Measures of EER?
- What the NEER and REER Data Shows?
How is the Strength or Weakness of the Rupee Decided?
- India trades not only with the US. It exports goods and services to other countries as well, while also importing from them.
- Hence, the strength or weakness of the rupee is a function of its exchange rate with not just the US dollar, but also with other global currencies.
- It is calculated by what is called the rupee’s effective exchange rate (EER).
What is the EER?
- The EER is measured by an index similar to the consumer price index (CPI).
- The CPI is the weighted average retail price of a representative consumer basket of goods and services for a given month or year, relative to a fixed base period.
- The EER is an index of the weighted average of the rupee’s exchange rates vis-à-vis the currencies of India’s major trading partners.
- The currency weights are derived from the share of the individual countries to India’s total foreign trade, just as the weights for each commodity in the CPI are based on their relative importance in the overall consumption basket.
What are the Two Measures of EER?
- Nominal EER (NEER):
- The Reserve Bank of India (RBI) has constructed NEER indices of the rupee against a basket of six and also of 40 currencies.
- The former is a trade-weighted average rate at which the rupee is exchangeable with a basic currency basket, comprising the US dollar, the euro, the Chinese yuan, the British pound, the Japanese yen and the Hong Kong dollar.
- The latter index covers a bigger basket of 40 currencies of countries that account for about 88% of India’s annual trade flows.
- The NEER indices are with reference to a base year value of 100 for 2015-16: Increases indicate the rupee’s effective appreciation against these currencies and decreases point to overall exchange rate depreciation.
- While the NEER is a summary index that captures movements in the external value of the Rs (against a basket of global currencies), the NEER does not factor in inflation (reflects changes in the internal value of the Rs).
- Real EER (REER):
- The REER is basically the NEER that is adjusted for the inflation differentials between the home country and its trading partners.
- If a country’s nominal exchange rate falls less than its domestic inflation rate - as with India - the currency has actually appreciated in “real” terms.
What the NEER and REER Data Shows?
- NEER:
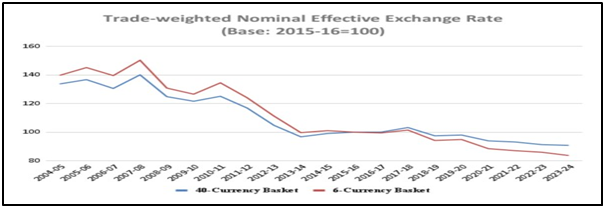
- The rupee’s 40-currency basket NEER has fallen by around 32.2% (from 133.8 to 90.8) between 2004-05 and 2023-24.
- The decline is even more - 40.2%, from 139.8 to 83.7 - for the narrower 6-currency basket NEER.
- During the same period, the rupee’s average exchange rate against the US dollar dropped by 45.7%, from Rs 44.9 to Rs 82.8.
- Simply put, the rupee’s “effective” depreciation of 32.2-40.2% against the 40-currencies has been lower than its corresponding depreciation of 45.7% against the US dollar.
- The reason for that is its weakening less relative to other currencies than vis-à-vis the dollar.
- REER:
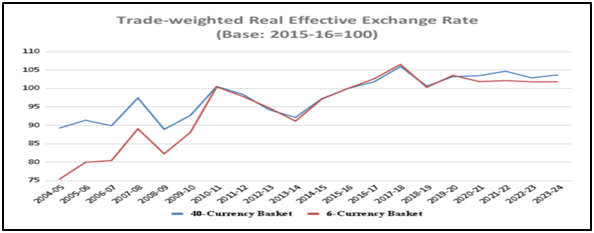
- The rupee has strengthened in real terms over time, while ruling at 100 or above in 9 out of the last 10 years.
- This is opposite to the trend of weakening if one takes only the rupee’s NEER or its exchange rate with the US dollar.
- Any increase in REER means that the costs of products being exported from India are rising more than the prices of imports into the country.
- That translates into a loss of trade competitiveness - which may not be quite a good thing in the long run.