Context:
- The Household Consumption Expenditure Surveys (HCES) for 2022–23 and 2023–24 by the National Statistical Office (NSO) provide updated insights into poverty and inequality trends in India.
- There is the need to explore trends in head count ratio, the depth of poverty and trends in inequality from 2011-12 to 2023-24.
Defining Poverty - Based on the Rangarajan Committee Methodology:
- Rural poverty lines (monthly per capita consumption expenditure - MPCE):
- 2011–12: ₹972
- 2022–23: ₹1,837
- 2023–24: ₹1,940
- Urban poverty lines (MPCE):
- 2011–12: ₹1,407
- 2022–23: ₹2,603
- 2023–24: ₹2,736 (For a family of five: ₹13,680).
Poverty Reduction Trends:
- Declining poverty ratios:
- Total poverty ratio (rural + urban) -
- 2011–12: 29.5%
- 2022–23: 9.5%
- 2023–24: 4.9%
- Poverty declined significantly between 2011-12 and 2023-24 (2.05 percentage points per annum), though the rate of decline was slightly less compared to the period 2004-05 to 2011-12 (2.2 percentage points per annum).
- Global comparison – World Bank insights:
- In India, extreme poverty (living on less than $2.15 per day in purchasing power parity terms) -
- 2011–12: 16.2%
- 2022–23: 2.3% - more than 170 million were lifted above conditions of extreme poverty in this period.
- The number of people below the poverty line criteria for lower-middle-income countries — $3.65 per day — fell from 61.8% to 28.1%.
Possible Drivers of 2023–24 Poverty Reduction:
- Key macroeconomic factors:
- GDP growth: GDP growth increased from 7.6% in 2022-23 to 9.2% in 2023-24 — an increase of 1.6 percentage points in one year.
- CPI inflation: The consumer price index (CPI) declined from 6.7% in 2022-23 to 5.4% in 2023-24 — a decline of 1.3 percentage points.
- Food Inflation: However, food inflation increased from 6.6% to 7.5% during the same period.
- Observation:
- As there are no major changes in welfare schemes, GDP growth appears as the most plausible reason for poverty reduction in 2023–24.
- However, caution is advised — trends must be validated by future data.
Depth of Poverty - Beyond the Headcount Ratio:
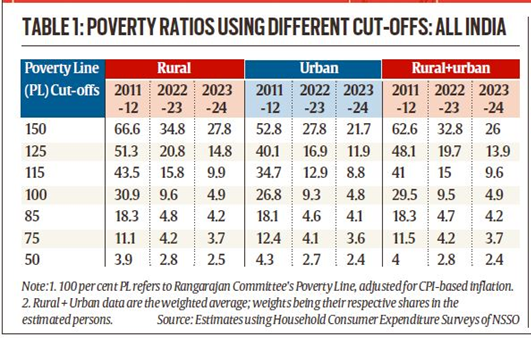
- Headcount ratio vs poverty depth: The headcount ratio measures the percentage of the population living below the poverty line, while poverty depth (also known as the poverty gap) measures the average distance between the poor and the poverty line.
- Observation: It can be concluded that many non-poor lie just above the poverty line (115–125% of PL). This means that most people are clustered around the poverty threshold.
Inequality Trends - Consumption Expenditure:
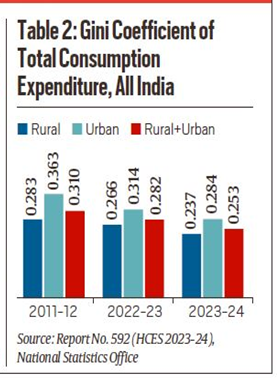
- Gini coefficient:
- The Gini coefficient is a statistical measure designed to quantify the level of income inequality within a population.
- It is a numerical value between 0 and 1, where 0 represents perfect equality (everyone has the same income) and 1 represents perfect inequality (one person has all the income).
- Observation:
- The decline in inequality was higher for urban areas.
- The inequality in consumption (Rural + Urban) declined significantly in one year — the Gini coefficient fell from 0.282 in 2022-23 to 0.253 points — a decline of 0.029 points.
- On the other hand, the decline during the 11-year period 2011-12 to 2022-23 is almost similar.
Conclusion:
- Poverty in India is now in single digits, and inequality has declined moderately.
- The significant one-year drop in poverty (2022–23 to 2023–24) may be driven by GDP growth but requires more data to confirm if it's a lasting trend.
- The concentration of the poor near the poverty line indicates better prospects for targeted policy interventions.