In News:
- The Abridged Life Tables report for the period of 2015-19 has been released by the Sample Registration System (SRS).
- Abridged Life Tables report presents the life tables for India and bigger States/Union Territories.
- A life table summarizes the mortality experience of a population during the period of study.
- It states the probabilities of death and survival of a hypothetical group or cohort at different ages.
What’s in Today’s Article:
- Sample Registration System (SRS)
- News Summary
In Focus: Sample Registration System (SRS)
Major source of vital statistics in India
- There are four major sources of vital statistics in India, namely
- Sample Registration System (SRS),
- Civil Registration System (CRS),
- Indirect estimates from the decennial census and
- Indirect estimates from the National Family Health Surveys (NFHS).
About
- The SRS is the most regular source of demographic statistics in India.
- It is based on a system of dual recording of births and deaths in fairly representative sample units spread all over the country.
- The office of the Registrar General & Census Commissioner, which works under the home ministry, is responsible for the release of SRS.
- It was initiated on a pilot basis by the Registrar General of India in a few states in 1964-65. It became fully operational during 1969-70.
Function
- The SRS provides annual estimates of
- population composition,
- fertility,
- mortality, and
- medical attention at the time of birth or death which give some idea about access to medical care.
News Summary
- As per the data in the recently released Abridged Life Tables 2015-19 of the SRS, India’s life expectancy at birth inched up to 69. 7 in the 2015-19 period.
Key Highlights of the report
- India’s life expectancy at birth
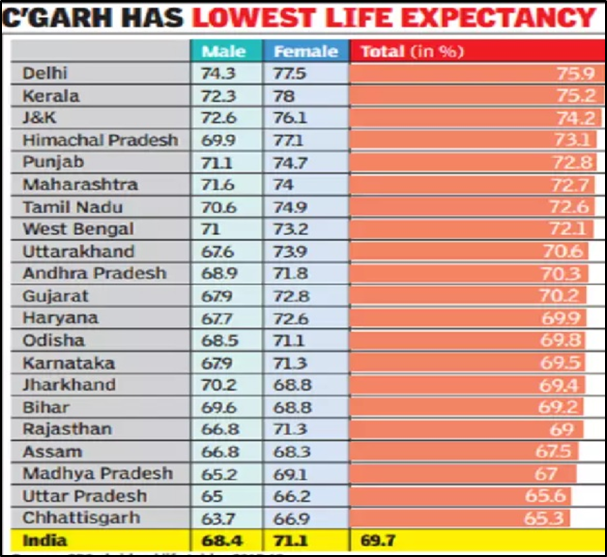
- India’s life expectancy at birth increased to 69. 7 in the 2015-19 period.
- However, it is well below the estimated global average life expectancy of 6 years.
- Difficulty in raising the life expectancy at birth faster
- It has taken almost ten years to add two years to life expectancy.
- A look at life expectancy at age one and at age five in this period suggests high infant and under-five mortality.
- This could be the reason India finds it difficult to raise life expectancy at birth faster.
- Top and bottom performers
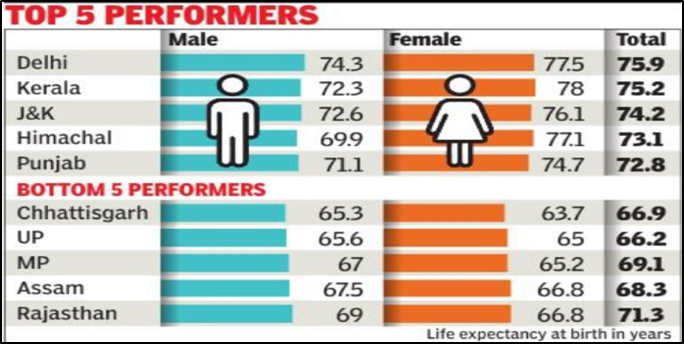
- Over a 45-year period, India had added about 20 years to its life expectancy at birth
- India’s life expectancy at birth increased from 49. 7 in 1970-75 to 69. 7 by 2015-19.
- Odisha has had the highest increase, of over 24 years, from 45. 7 to 69. 8 years followed by Tamil Nadu, where it increased from 49. 6 to 72. 6.
- Huge rural-urban variation
- Within India, there are huge variations across states and between urban and rural areas.
- Kerala is the only state where rural life expectancy was higher than urban life expectancy for both men and women.
- In Uttarakhand that was the case among women.
- Bihar and Jharkhand remained the only states where male life expectancy was higher than for women in both urban and rural areas.
- Life expectancy at birth of different countries (as per UN’s Human Development Report, 2019)
- In the neighbourhood, Bangladesh and Nepal now have higher life expectancy at birth of 72. 1 and 70. 5 respectively.
- Japan has the highest life expectancy of 85. Norway, Australia, Switzerland and Iceland had a life expectancy of 83.