Why in News?
- On February 12, 2026, the Ministry of Statistics and Programme Implementation (MoSPI) released India’s first retail inflation data under the new Consumer Price Index (CPI) series (Base Year: 2024=100).
- Retail inflation for January 2026 stood at 2.75% (provisional) — the first official reading under the revised framework.
- This revision replaces the earlier 2012 base year, reflecting changes in consumption behaviour, market structures, and household expenditure patterns, as captured by the Household Consumption Expenditure Survey (HCES) 2023–24.
What’s in Today’s Article?
- Why a New CPI Series?
- Key Structural Changes in the New CPI
- Revised Weight Structure - Changing Consumption Patterns
- Inflation Numbers (January 2026)
- Challenges and Way Forward
- Conclusion
Why a New CPI Series?
- India’s economy has undergone structural transformation over the past decade.
- For example,
- Rising share of services
- Growth of digital consumption
- Shift toward cleaner fuels
- Changing food patterns
- Expansion of online marketplaces
- The new CPI aligns inflation measurement with current consumption realities, thereby improving its relevance for monetary policy (RBI), fiscal policy calibration, wage indexation, welfare schemes, GDP deflation and national accounts.
- Significance for monetary and fiscal policy:
- The CPI is the primary inflation measure for RBI’s Monetary Policy Committee (MPC), linked to the inflation targeting framework (4% ± 2%), and is used for DA revisions, poverty estimation, real income calculation, welfare transfers.
- Lower weight of volatile food items may reduce short-term fluctuations, and provide clearer inflation signals.
Key Structural Changes in the New CPI:
- Updated base year: Changed from 2012 to 2024, ensuring contemporary relevance.
- Adoption of international classification:
- The new series adopts 12 consumption divisions in line with the COICOP 2018 (Classification of Individual Consumption According to Purpose) framework.
- 12 divisions (more granular) from earlier structure (6 groups) enhances comparability with global inflation standards.
- Expanded coverage of items: Total items increased from 299 to 358 (goods increased to 308 from 259, and services from 40 to 50). This reflects growth of the services economy, and modern consumption patterns.
- New items added:
- Rural house rent (introduced for the first time)
- Online media and streaming services
- Value-added dairy products
- Barley and related products
- Pen drives, external hard disks
- Attendant and babysitter services
- Exercise equipment
- Cleaner fuels (CNG/PNG)
- Removed items: VCR/VCD/DVD players, tape recorders, radios, CD/DVD cassettes, second-hand clothing, coir/rope, reflecting technological obsolescence and lifestyle shift.
- Wider data collection:
- The new series collects data from more sources across the country. For example, data is collected from 1,465 rural markets (up from 1,181) and 1,395 urban markets (up from 1,114).
- The new series also collects data from 12 online marketplaces. Inclusion of online platforms is a major methodological advancement.
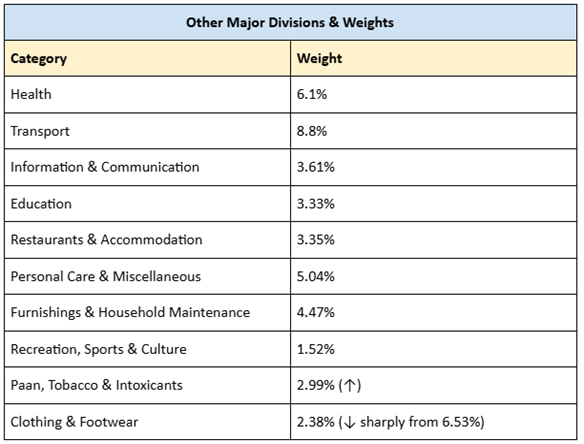
Revised Weight Structure - Changing Consumption Patterns:
- Food and beverages:
- Weight reduced to 36.75% (from 45.86%).
- Implication: Headline inflation may become less volatile, as food prices are typically unstable. Food still remains the largest
- Housing (expanded category):
- Weight increased from 10.07% to 17.67%.
- Now expanded to include water, electricity, gas, and other fuels. Also introduces rural house rent, improving representativeness.
Inflation Numbers (January 2026):
- Headline CPI Inflation (2.75%): Rural: 2.73%, Urban: 2.77%
- Food Inflation (CFPI): 2.13%
- Rural: 1.96%
- Urban: 2.44%
- Housing Inflation: 2.05%
- Rural: 2.39%
- Urban: 1.92%
- Historical comparison is limited since this is the first release under the new base. A linking factor has been provided to compute backward-compatible index values up to 2013.
Challenges and Way Forward:
- Comparability issues: Break in time series complicates long-term analysis. Integrate CPI data with big data analytics.
- Data consistency: Linking factor may not perfectly replicate old series trends. Enhance transparency in linking methodology.
- Food weight reduction debate: India remains a lower-middle-income economy where food inflation impacts welfare significantly. Ensure regular revision cycles (every 5–10 years).
- Rural representation concerns: Despite expansion, informal consumption may still be underreported. Strengthen rural data infrastructure. Increase public statistical literacy.
- Online price volatility: Digital marketplace pricing can fluctuate dynamically. Improve real-time digital price collection systems.
Conclusion:
- The launch of the CPI Base 2024 series marks a crucial reform in India’s statistical architecture.
- By aligning inflation measurement with contemporary consumption patterns and international standards, the new series enhances the reliability of inflation signals for policymakers.
- However, maintaining continuity, credibility, and transparency will be essential to ensure that the CPI remains a trusted macroeconomic anchor in India’s inflation-targeting regime.
- In essence, this is not just a statistical update—it is a recalibration of how India measures the cost of living in a transforming economy.