Context
- The government is going to launch fieldwork for the new Consumer Expenditure Survey on 1st July, 2022.
- The survey will cover around 1.2 lakh households in rural areas and around 84,000 households in urban areas and will help draw poverty estimates after a decade-long gap.
Background
- The last two such nationwide Consumer Expenditure Surveys (CES) were carried out in 2011-12 and 2017-18.
- Unfortunately, the results of the 2017-18 survey were not released on grounds of unexplained “data quality issues”.
- Studies based on leaked survey findings had pointed to a rise in poverty levels in 2017-18.
- Thus the last Consumer Expenditure Survey (CES) was conducted in the 68th round (July 2011 to June 2012).
- Effectively, it means there is no official data after 2011-12 for estimating poverty lines and ratios, based on consumption spending below a certain level and the percentage of households falling within that deprivation threshold.
About Consumer Expenditure Survey (CES)
- Agency and Time frame: The consumer expenditure survey, usually conducted by the National Sample Survey Office (NSSO) (now comes under the National Statistical Office), Ministry of Statistics and Programme Implementation, at quinquennial (every five years) intervals.
- In May 2019, the Indian government passed the order to merge the NSSO with the Central Statistics Office (CSO) to form the National Statistical Office (NSO).
- Items: It is designed to collect information regarding expenditure on consumption of goods and services (food and non-food) consumed by households. It is the amount of final consumption expenditure made by resident households to meet their everyday needs, such as food, clothing, housing (rent), energy, transport, durable goods (notably cars), health costs, leisure, and miscellaneous services.
- Aim: It aims at generating estimates of household Monthly Per Capita Consumer Expenditure (MPCE) and the distribution of households and persons over the MPCE range separately for the rural and urban sectors across the country and for different socio-economic groups.
Significance of Consumer Expenditure Survey
- Macro indicators: The results of consumer expenditure survey are used for rebasing of the GDP and other macroeconomic indicators. It also helps in calculating the demand dynamics of the economy.
- Identify anomalies: The CES addresses the possible structural anomalies that may cause demand to shift in a particular manner in a specific socio-economic or regional division of the population.
- Setting priorities: Helps in understanding the shifting priorities in terms of baskets of goods and services, thus providing pointers to the producers of goods and providers of services.
- Negative effects: The delay in undertaking a household consumption expenditure survey leaves us unsure of the trend in poverty in India in recent years.
Revamped features in new survey
- Coverage: The results will include separate data sets for rural and urban parts, and splice spending patterns for each State and Union Territory, as well as different socio–economic groups.
- Enhanced visits: The three visits by an enumerator to a household in new Consumer Expenditure Survey to seek more detailed information on their consumption basket.
- Interrogation: The three visits to a household to collect data on consumption expenditure will entail seeking information on daily use items (on a 7-day basis), regular items (on a 30-day basis) and consumer durables (on a 365-day basis).
- Also, the detailed questions for seeking inputs on welfare subsidies such as food grains are learnt to have been included.
- Expanded basket: The basket has been expanded in the new round with inclusion of items which have seen higher consumption trends in recent times.
- Segregation: The largest category of ‘miscellaneous’ items has been segregated for detailed collection of data on consumption of those items them along with more detailed questions on food, education and health.
- Increased manpower: About 1,700 investigators are likely to be engaged in the revamped consumer expenditure survey, as against 800-900 earlier.
Need for revamped survey
- New items: It was felt that the earlier schedule doesn’t capture goods and services which have come more recently and they should be included.
- Duration: It was also felt that survey time should not be more than 40 minutes. The old schedule used to take two hours.
- Bifurcation: Now by adding more items it’ll take more time. So it was decided to be split into three visits of approximately 40 minutes each and collect different parts of the schedule at different points of time. The same investigator will visit the same house on each visit,” the source said.
Criticism of new survey
- Tedious process: The revamped procedure would include an increase in the working time owing to enhanced visits and a possibility of overestimating consumption.
- Incomparable estimates: The changes in data collection, items and methodology may make the results incomparable with previous consumer expenditure surveys and new poverty estimates will have to be drawn since they won’t be consistent with earlier ones.
Key Findings of Consumer Expenditure Survey 2011-12
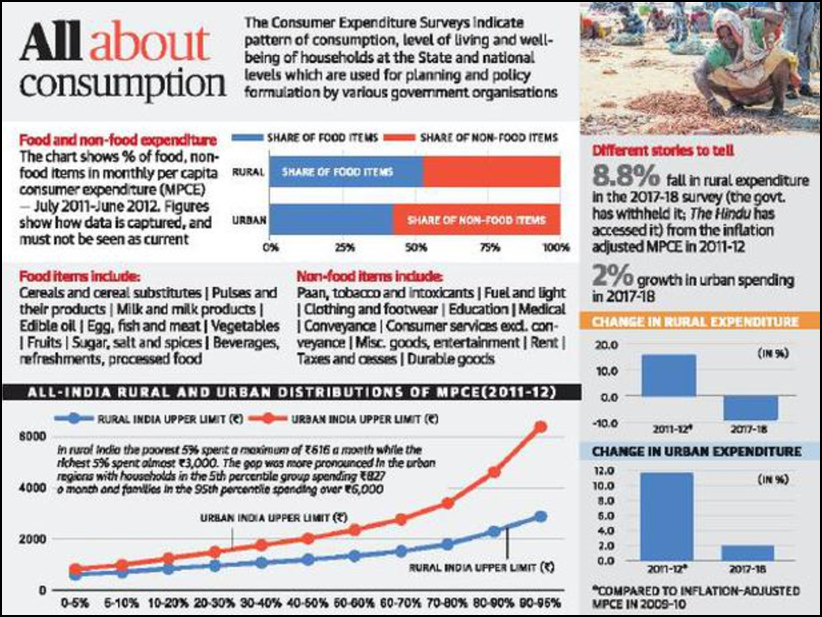
- The survey showed that average urban MPCE (at ₹2,630) was about 84% higher than average rural MPCE (₹1,430) for the country as a whole.
- Food accounted for about 53% of the value of the average rural Indian household’s consumption during 2011-12.
- In the case of urban households, it accounted for only 42.6% of the average consumption budget.
- While education accounted for 3.5% of the rural household’s average spending, an urban household spent almost 7% of its monthly consumption budget on it.
Conclusion
- The Planning Commission estimates in 1997 showed a slowing of the rate of poverty reduction soon after the reforms, resulting in a rise in the number of poor in 1993-94 for the first time in 15 years. However, the then government did not squash the study like the recently quashed 2017-18 one.
- The high growth rates and government welfare programmes have little meaning, especially in India, if these do not result in reducing poverty. But without data, it’s difficult to gauge its regularity and improvements in indicators.
- Since government decision-making has to be dynamic and responsive to changing ground situations, the data has to keep flowing. While the CES’s launch is timely, the government should move to doing surveys on a more regular basis.