Why in News?
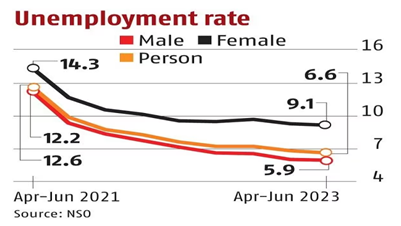
- According to the quarterly bulletin of PLFS released by the Ministry of Statistics and Programme Implementation (MoSPI), urban unemployment rate in April-June (the first quarter/Q1 of this fiscal) fell to 6.6%.
- Despite the fact that the urban unemployment rate was at its lowest since the PLFS bulletin was launched, nearly 14 states had a higher urban unemployment rate than the national average.
What’s in Today’s Article?
- Periodic Labour Force Survey (PLFS)
- Meaning of Unemployment
- How the Unemployment Rate is Measured?
- Highlights of the quarterly bulletin of PLFS
The Periodic Labour Force Survey (PLFS):
- About:
- PLFS was launched by the National Statistical Office (NSO) in 2017, considering the importance of availability of labour force data at more frequent time intervals.
- The first annual report (conducted during July 2017-June 2018), was brought out by NSO on the basis of PLFS and released in 2019.
- Objectives:
- To estimate the key employment and unemployment indicators (for example, Labour Force Participation Rate, etc) in the short time interval of 3 months for the urban areas only in the Current Weekly Status (CWS = 7 days preceding date of the survey).
- To estimate employment and unemployment indicators in both usual status and CWS in both rural and urban areas annually.
- Key employment and unemployment indicators of PLFS:
- Labour Force Participation Rate (LFPR): It is defined as the percentage of persons in the labour force (working or seeking or available for work) in the population.
- Worker Population Ratio (WPR): It is defined as the percentage of employed persons in the population.
- Unemployment Rate (UR): UR is defined as the percentage of persons unemployed among the persons in the labour force.
- Activity Status: The activity status of a person is determined on the basis of the activities pursued by the person during the specified reference period.
- Usual Status: Usual activity status is determined on the basis of the reference period of the last 365 days preceding the date of survey.
- Current Weekly Status (CWS): Labour force according to CWS is the number of persons either employed or unemployed on an average in a week preceding the date of survey.
- Usual status unemployment rates will always be lower than CWS rates because there is a greater probability that an individual would find work over a year as compared to a week.
Meaning of Unemployment:
- According to the International Labour Organisation (ILO), unemployment means being out of a job; being available to take a job; and actively engaged in searching for work.
- Therefore, an individual who has lost work but does not look for another job is not unemployed. Thus, unemployment is not synonymous with joblessness.
How the Unemployment Rate is Measured?
- The unemployment rate is measured as the ratio of the unemployed to the labour force.
- The labour force is defined as the sum of the employed and the unemployed.
- Those neither employed nor unemployed such as students and those engaged in unpaid domestic work are considered out of the labour force.
- For example, in the US, the employment-to-population ratio (EPR) in 2019 was 60.8, while the unemployment rate was 3.7%. In 2022, the EPR was 60, but the unemployment rate had fallen to 3.6%.
- Even though there were fewer jobs (as a proportion of the total population), the unemployment rate was lower because many individuals had exited the labour force.
- The unemployment rate could also fall if an economy is not generating enough jobs, or if people decide not to search for work.
Highlights of the quarterly bulletin of PLFS in the Urban Areas:
- LFPR for persons of age 15 years and above in CWS ranged from 46.2 to 47.8% during the pre-pandemic period.
- LFPR during April-June 2023 was 48.8% which is higher than the LFPR observed in the quarters covered in the pre-pandemic period.
- WPR for persons of age 15 years and above in CWS ranged from 41.8 to 44.1% during the pre-pandemic period.
- WPR during April-June 2023 was 45.5% which is higher than the WPR observed in the quarters covered in the pre-pandemic period.
- The Unemployment Rate (for persons of age 15 years and above in CWS) during April-June 2023 was 6% is lower than the unemployment rates observed in the quarters covered in the pre-pandemic period (7.8 to 9.7%).
- Employment of both males and females, however, increased in self-employed categories such as own account worker, helper in household enterprise.
- States/UTs which recorded higher than national average unemployment rate included Himachal Pradesh (13.8%), Rajasthan (11.7%), Chhattisgarh (11.2%), etc.
- States/UTs which posted a lower-than-national average unemployment rate were Delhi (2.7%), Gujarat (2.8%), West Bengal (4.4%), Bihar (6.1%), etc.