In News:
- The Department of School Education and Literacy, has released the Performance Grading Index for Districts (PGI-D) for 2019-20.
What’s in Today’s Article:
- Performance Grading Index for Districts – About, methodology, necessity of such report
- Key Highlights of the report
In Focus: Performance Grading Index for Districts (PGI-D)
- The Performance Grading Index is a tool to provide insights on the status of school education in States and UTs.
- It also provides ideas about key levers that drive their performance and critical areas for improvement.
- Grading will allow all States and UTs to occupy the highest levele Grade I, at the same time which is a sign of fully developed nation.
- The Department of School Education and Literacy (DoSE and L), Ministry of Education (MoE) is responsible for publishing the report.
Methodology
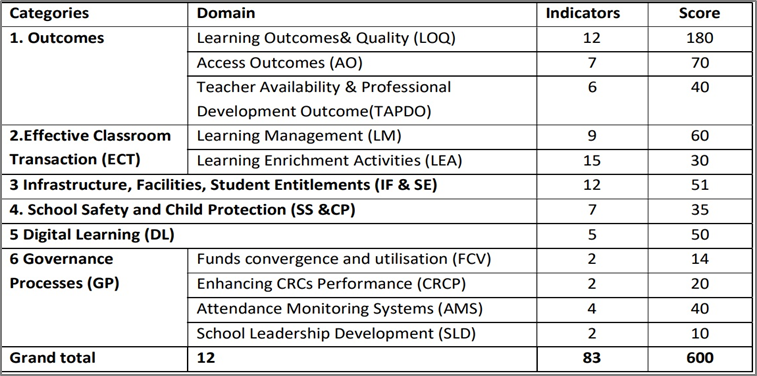
- The PGI-D structure comprises of total weightage of 600 points across 83 indicators, which are grouped under 6 categories, which are:
- Outcomes, Effective Classroom Transaction, Infrastructure Facilities & Student’s Entitlements, School Safety & Child Protection, Digital Learning and Governance Process.
- The States and UTs are assessed on the basis of their performance against the benchmark for each indicator.
Classification into various grades
- In PGI-D, based on overall scores, districts are classified into various grades.
- Highest achievable Grade in PGI-D is Daksha for Districts scoring more than 90% of the total points in that category or overall.
- Utkarsh – for PGI score of 81% to 90% and so on
- Position of a district in different grading categories is relative and can change depending upon its performance in each year.
Necessity of this report
- The Indian Education System is one of the largest in the world with more than 1.5 million schools, 8.5 million teachers and 250 million children from varied socio-economic backgrounds.
- Hence, there is need to maintain standards and uniformity across the country while giving ample scope for the country’s diverse culture and heritage to grow and flourish.
- The Index will propel the States and UTs towards undertaking multi-pronged interventions that will bring about the much-desired optimal education outcomes.
Key highlights of the report
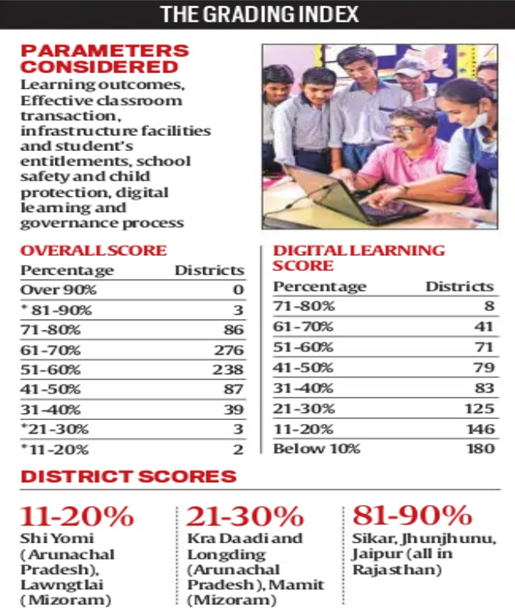
- Exposure to digital learning
- As India entered the pandemic year, students in around 61 per cent districts of the country had very little exposure to digital learning.
- This is due to limited availability of computers, Internet facilities and teachers trained to handle technological tools in schools.
- The report shows that schools across India performed poorly under the category of digital learning.
- As many as 180 districts scored less than 10 per cent on digital learning, 146 districts scored 11 to 20 per cent, while 125 districts had scores between 21 and 30 per cent.
- Rural-urban divide in the area of digital learning
- The report also underlines the clear rural-urban divide in the area of digital learning.
- For instance, while districts in cities like Chandigarh and Delhi scored between 25 and 35 out of 50, places like Bihar’s Araria and Kishanganj scored as low as 2.
- Learning outcomes
- In terms of learning outcomes, no district scored below 10 per cent, 12 scored between 11 and 20 per cent, while as many as 309 scored between 51 and 60 per cent.
- Best performers in the index
- Chandigarh and the states of Punjab, Tamil Nadu and Kerala were the best performers in the index.
- Considerable inter-state difference
- On a maximum possible of 1000 points, the range between the States and UTs with the highest and the lowest score is almost 300.
- This is 30% of the maximum points.
- Thus, there exists a considerable difference between the States and UTs as far as their performance in the arena of School Education is concerned.