Why in news?
India's Index of Industrial Production (IIP) grew 7.3% year-on-year in June 2026 — its highest in 23 months — even as most observers expect India's overall growth to slow this year.
This contrast prompts a closer look at which sectors are driving growth and which are lagging.
What’s in Today’s Article?
- What is the IIP?
- Two Ways to Read IIP Data
- The Real Story: A Quarterly Trend Reveals a Demand Divide
- Conclusion
What is the IIP?
- The IIP tracks changes in the volume of production across Indian industries.
- It selects a basket of industrial products — spanning manufacturing, mining, and energy — and assigns different weights to each sector to build a composite index.
- Production is tracked monthly and compared with the same month in the previous year to gauge industrial health.
Two Ways to Read IIP Data
- Sectoral Classification
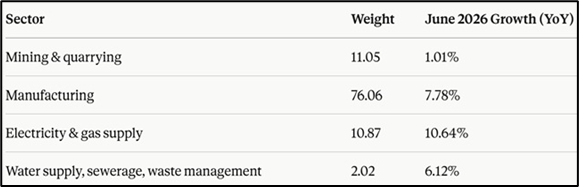
- Manufacturing, with the largest weight, drove overall growth, while mining lagged significantly.
- Use-Based Classification
- This method categorises goods by their end-use, offering insight into the nature of demand:
- Primary goods: Natural resources (minerals, fossil fuels) used in industry.
- Intermediate goods: Incomplete goods (e.g., cotton yarn) used to produce other goods.
- Capital goods: Manufactured goods (e.g., tractors, commercial vehicles) used in production, but not as inputs.
- Infrastructure/construction goods: Finished goods used mainly in infrastructure.
- Consumer durables: Longer life-span goods (e.g., TVs, cars).
- Consumer non-durables: Goods for immediate consumption (e.g., milk, biscuits).
- In June 2026, capital goods (14.23%) and intermediate goods (9.33%) posted the strongest growth, while consumer non-durables (4.91%) lagged well behind.
The Real Story: A Quarterly Trend Reveals a Demand Divide
- Looking at quarterly data over the past nine months reveals a consistent pattern:
- Capital, infrastructure, and intermediate goods have shown strong, sustained growth — reflecting robust government infrastructure spending.
- Consumer goods, especially non-durables, have shown persistently weak growth — signalling soft demand.
- Since April 2024, capital and intermediate goods have consistently outperformed consumer goods, with trend growth rates of 9.6% and 5.9% respectively.
- Expert Insights
- Weak consumer demand persists in both rural and urban India, driven by higher prices — visible in the corporate earnings of FMCG (fast-moving consumer goods) companies.
- Strong capital/infrastructure goods growth aligns with government infrastructure spending, which also lifts intermediate goods (metals, machinery).
- Weakness in consumer goods IIP through FY26 was largely driven by pharmaceuticals, electronics, apparel, and leather — sectors most exposed to tariff-related uncertainties.
- Consumer goods underperforming capital/intermediate goods is "more the norm than an exception."
- Weak primary goods growth is linked to supply disruptions and higher prices stemming from events in West Asia.
- The IIP trend is consistent with the broader picture shown by India's GDP growth data.
Conclusion
India's 23-month-high IIP growth presents a deceptively rosy picture. A sectoral breakdown shows the surge is driven chiefly by government-backed capital and infrastructure spending, while consumer demand — especially for non-durables — remains weak amid high prices and global tariff uncertainties.
This divergence suggests India's industrial recovery is uneven, with production growth not yet translating into broad-based consumption strength.